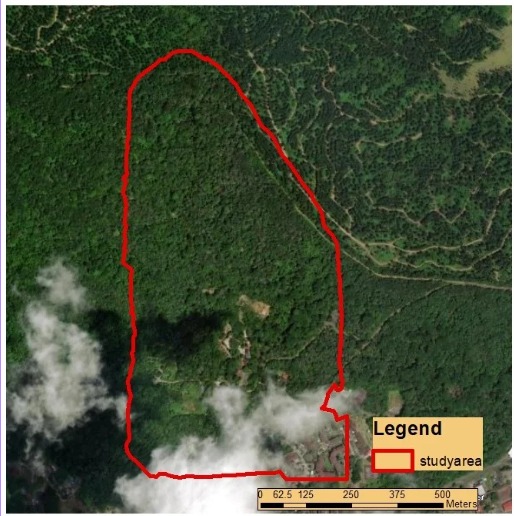
Mapping Cooling Effect of Forest Canopy

Introducing to you Group 5 for Khemah Latihan GIS II Semester 24/25

Start

About the Project

Forest canopy

Our Mission

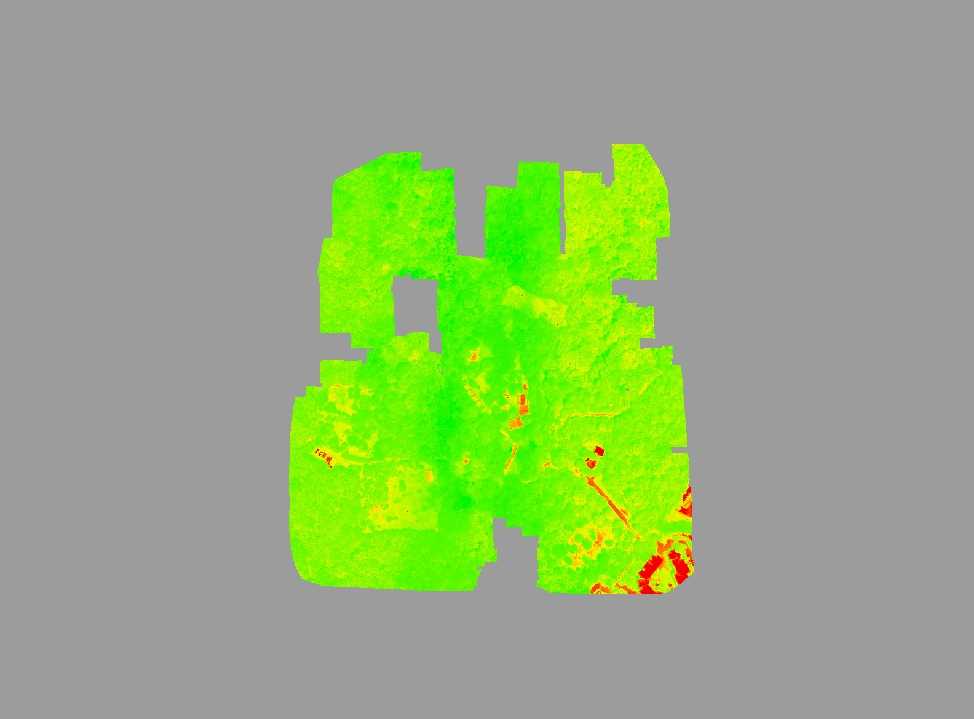
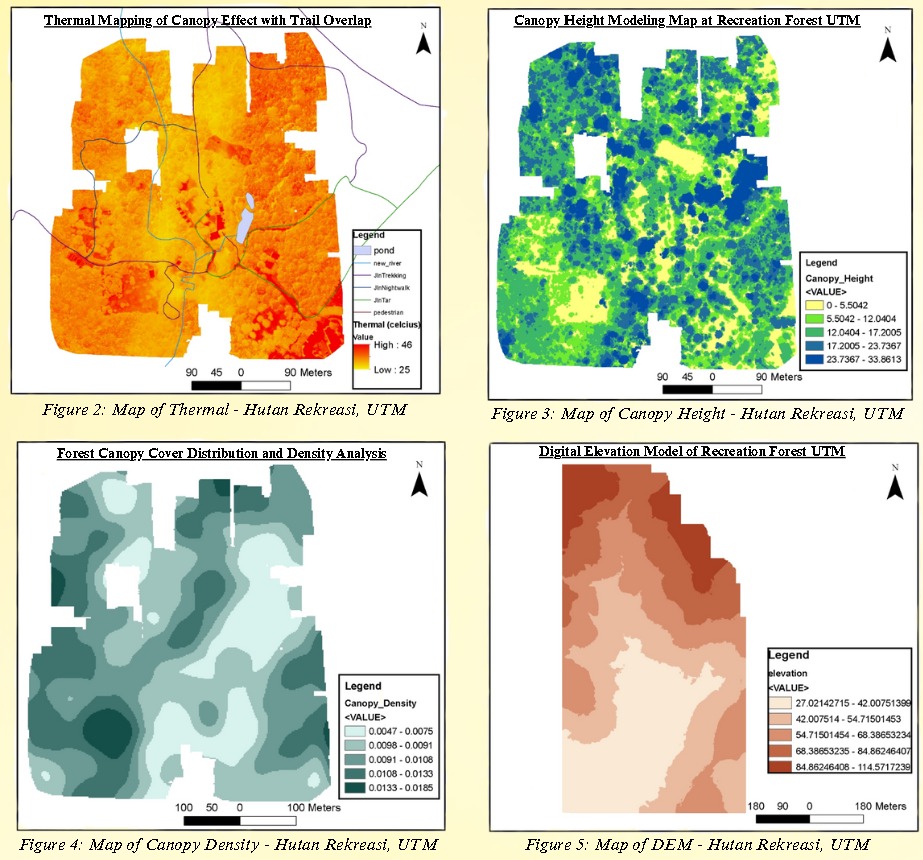
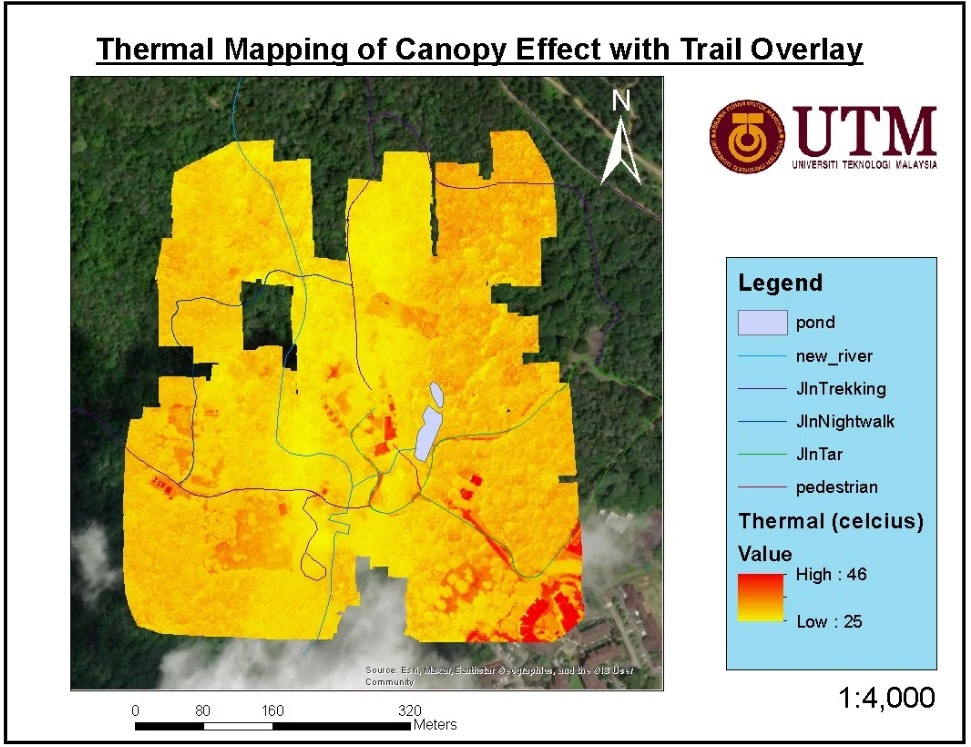
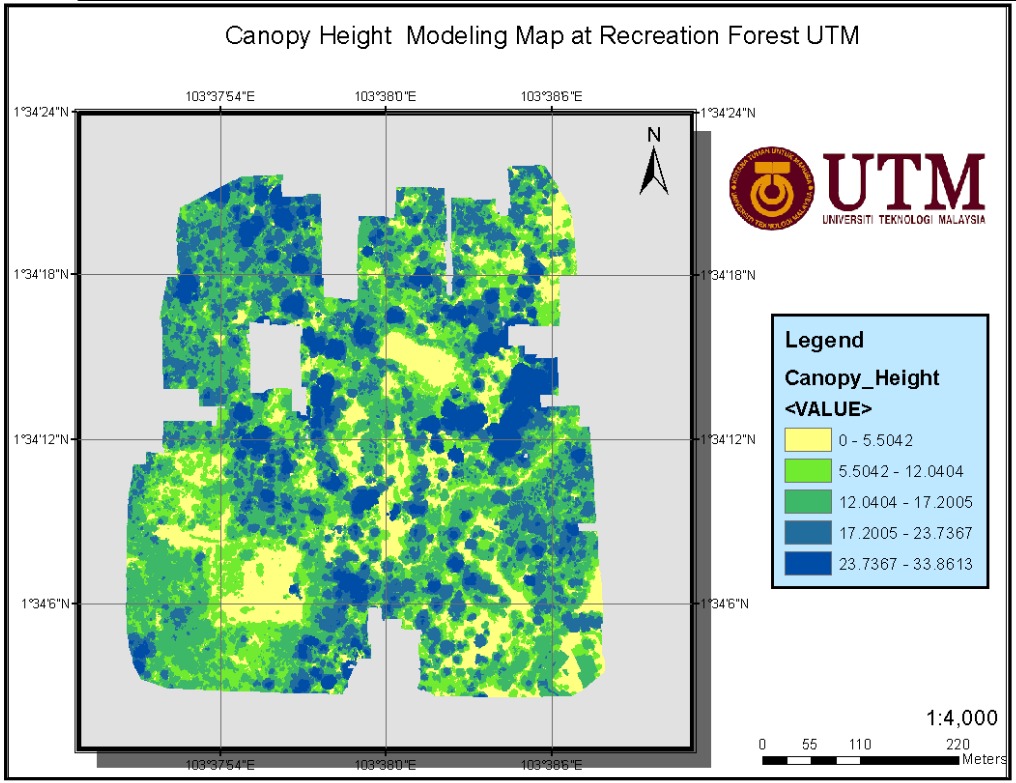
Forests help to regulate temperature by cooling it. The forest canopy offers shade and promotes evapotranspiration, which reduces ambient heat. Mapping the cooling effect of forest canopies aids in understanding their influence on urban microclimates and sustainable development.

Project Goals

  • To identify and map significant cooling zones within the forest.
  • To analyze the impact of forest cooling zones on the surrounding urban areas.
  • To evaluate the effectiveness of green cover in mitigating urban heat islands.

Our research combines remote sensing, field measurements, and advanced geospatial analysis to create comprehensive models of forest cooling effects across different ecosystems and seasons.

Project Methodology

Our systematic approach to measuring forest canopy cooling effects through advanced remote sensing techniques follows this sequential process:

1
Study area selection

Study Area Selection

Identifying diverse canopy sites within Hutan Rekreasi for comprehensive sampling.

2
GNSS Survey

GNSS Survey

Marking ground control points (GCP) and check points (CP) using TOPCON GR-5 GNSS equipment.

3
Equipment setup

Equipment Setup

Preparing and calibrating the DJI Matrice 300 RTK drone system for aerial data collection.

4
UAV Data Collection

UAV Data Collection

Capturing high-resolution thermal imagery and LiDAR data across the selected forest areas.

5
Data Processing

Data Processing

Extracting Land Surface Temperature (LST), generating DEM/DSM/CHM models, and aligning datasets for analysis.

6
GIS Analysis

GIS Analysis & Mapping

Utilizing ArcGIS to create comprehensive cooling effect maps based on processed data.

7
Interpretation

Interpretation & Conclusion

Identifying key cooling areas and finalizing research results with actionable insights.

What we have found

Key Findings

Relation between temperature and canopy density

# Higher canopy density generally correlates with cooler surface temperatures in thermal maps, while lower canopy density may result in warmer areas

# In the study "Remote sensing of urban heat islands: A review" by Chen et al. (2011), the authors state:

"Vegetation has a significant cooling effect on surface temperatures, which can be observed through remote sensing techniques."

Relation between temperature and canopy height (CHM)

# Taller canopies (higher CHM values) are frequently correlated with lower surface temperatures in thermal maps due to enhanced shade and transpiration. Conversely, shorter canopies or exposed ground may have higher temperatures.

# In the study Lefsky et al. (2002) in "Lidar remote sensing for ecosystem studies" the authors state:

"LiDAR-derived canopy height models are crucial for assessing vegetation structure, which directly impacts microclimatic conditions."

Relation between temperature and elevation (DEM)

# In thermal mapping, locations at higher elevations may have cooler surface temperatures than lower elevations, assuming similar land cover types. However, the combination of elevation and canopy density might confuse this relationship, since dense vegetation at higher elevations can help to cool temperatures even more.

# In the study Influence of spatial information resolution on the relation between elevation and temperature by Joly et al. (2018), the authors state:

"The slope given by the regression is used to assess the drop in temperature per unit of elevation (temperature lapse rate [TLR])"

Mapping Output

Detailed geographical insights into forest cooling effects

Map 1 Placeholder

Thermal Map

Map 2 Placeholder

Canopy Density Map

Map 3 Placeholder

Canopy Height Map

Map 4 Placeholder

Surface Elevation Map

Our Team

Meet the researchers behind the Forest Canopy Cooling Effect project

Team Member

MUHAMMAD AMIR HAZIQ

Project Leader and Programmer

Specializes in forest ecology and microclimate analysis.

Team Member

MOHAMMAD ADLI

Project Analysis

Expert in satellite imagery analysis and geospatial modeling techniques.

Team Member

UMI NADZIRAH

Project Manager

Specializes in environmental data analysis and predictive modeling.

Team Member

NUR AZREENA AQILAH

Project Technical

Focuses on urban heat islands and nature-based climate solutions.

Canopy Cooling Effect

Mapping the Cooling Effect of Forest Canopy

© 2025 Group 5 KL GIS 2. All Rights Reserved.